เมื่อเราได้ Dataset ใหม่มา สิ่งแรกที่เราควรทำ คือ Exploratory Data Analysis (EDA) ทำความเข้าใจข้อมูล ในแต่ละ Feaure เช่น ข้อมูลเป็นชนิดอะไร, ข้อมูลเป็นแบบต่อเนื่องหรือไม่ต่อเนื่อง, ช่วงของข้อมูลกว้างแค่ไหน, การกระจายของข้อมูลเป็นอย่างไร, มีข้อมูลขาดหายไปเยอะแค่ไหน, แต่ละ Feature เชื่อมโยงกันอย่างไร
การวิเคราะห์ทั้งหมดนี้ค่อนข้างซับซ้อน และซ้ำซ้อนเหมือนกันในทุก ๆ Dataset จะมีวิธีไหนที่จะทำให้งานซ้ำ ๆ เหล่านี้ง่ายขึ้น
Pandas DataFrame.describe()
ในการวิเคราะห์ข้อมูลแบบตาราง ปกติเราจะใช้ Pandas DataFrame และฟังก์ชันแรก ๆ ที่เราจะใช้ดูภาพรวมของตารางข้อมูล ก็คือ datarame.describe()
แต่ข้อเสียของ describe คือ output ออกมาเป็นตารางเดียวง่าย ๆ ที่มีข้อมูลน้อยเกินไป ทำให้เราต้องเขียนโปรแกรมเพิ่ม เพื่อเปรียบเทียบ เชื่อมโยงข้อมูลที่เราอยากรู้เอง ซึ่งก็เป็นงานซ้ำ ๆ กันที่ต้องทำคล้าย ๆ กันในทุก ๆ Dataset
Pandas Profiling
เปรียบเทียบกับ DataFrame.describe() ที่ Output ออกมาเป็นตารางเดียวง่าย ๆ แต่ Pandas Profiling จะวิเคราะห์ข้อมูล Feature ต่าง ๆ ใน DataFrame แล้วจัดทำ Report เต็มรูปแบบ Output ออกมาเป็น HTML เป็นกราฟสวยงาม มีรายละเอียดดังนี้
- Essentials: type, unique values, missing values
- Quantile statistics like minimum value, Q1, median, Q3, maximum, range, interquartile range
- Descriptive statistics like mean, mode, standard deviation, sum, median absolute deviation, coefficient of variation, kurtosis, skewness
- Most frequent values
- Histogram
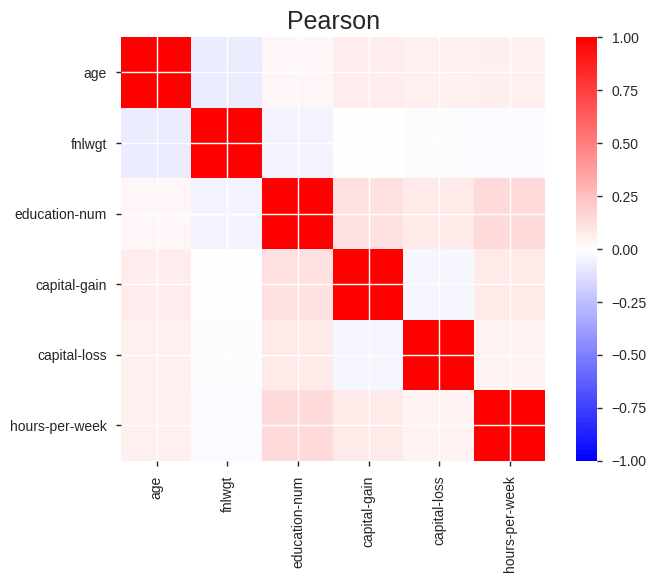
- Correlations highlighting of highly correlated variables, Spearman, Pearson and Kendall matrices
- Missing values matrix, count, heatmap and dendrogram of missing values
เรามาเริ่มกันเลยดีกว่า
![]()
![]()