ในเคสนี้ เราจะสมมติตัวเองเป็นตำรวจในเมืองบอสตัน เราจะใช้ Dataset ที่เรามีมาวิเคราะห์อาชญากรรม ที่เกิดขึ้นในเมือง Boston ป้องกันปราบปรามอาชญากรรม ในเมืองนี้ให้ลดน้อยลงได้อย่างไร

A car that has been burglarized. Credit https://commons.wikimedia.org/wiki/File:Car_window_burglary.jpg

เนื่องจากข้อมูลค่อนข้างมาก เราจะ Focus เฉพาะ อาชญากรรมประเภท โจรกรรม ปล้น ชิงทรัพย์ ที่เกิดในเวลากลางวัน ในปี 2018 โดยเราจะ drop record ที่ไม่มีพิกัด Lat, Long ทิ้งไปก่อน
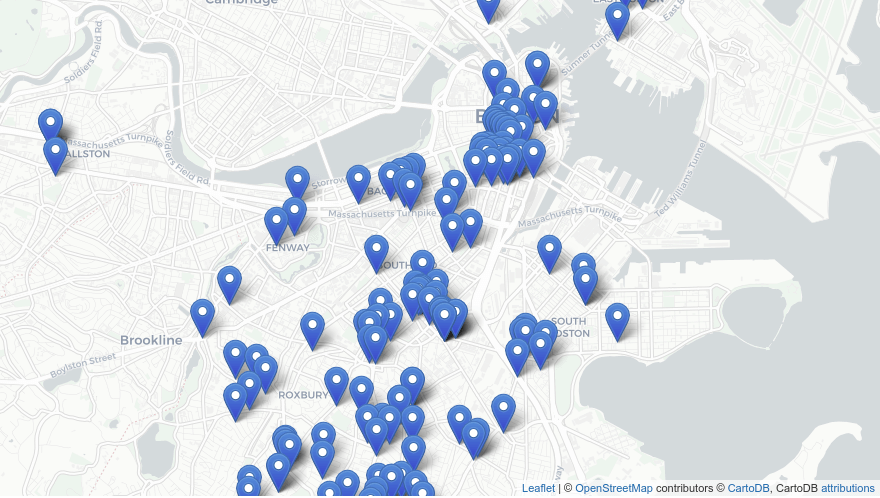
Geospatial Analysis

boston daytime robberies crimes heat map

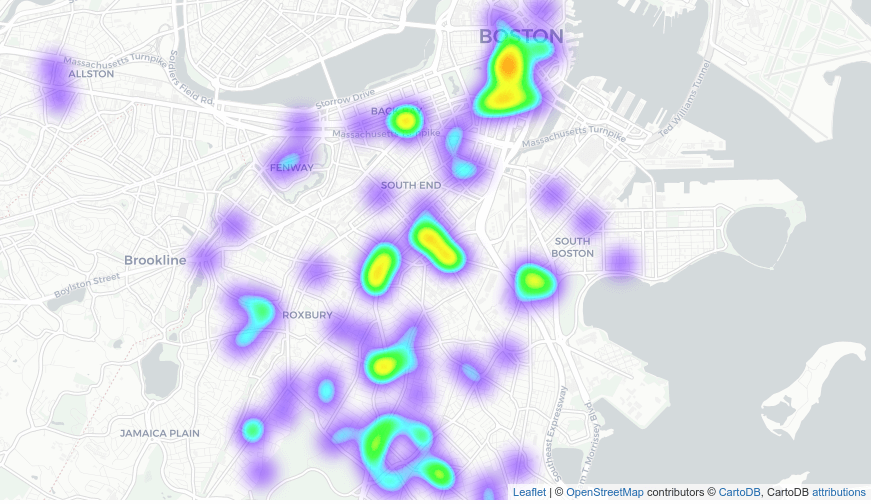
พล็อตแผนที่ความร้อน Heat Map ที่เข้าใจง่าย ว่าบริเวณไหนเกิดเหตุการณ์บ่อย ความหนาแน่นมาก ก็จะเป็นสีแดง (ร้อน) เกิดน้อย ความหนาแน่นน้อย ก็จะเป็นสีน้ำเงิน (เย็น) 

สังเกตว่าเมืองใหญ่ อาชญากรรมส่วนใหญ่มักจะเกิดบริเวณใจกลางเมือง

เรามาเริ่มกันเลยดีกว่า

Open In Colab

แชร์ให้เพื่อน:

Surapong Kanoktipsatharporn on FacebookSurapong Kanoktipsatharporn on LinkedinSurapong Kanoktipsatharporn on Rss
Surapong Kanoktipsatharporn
Solutions Architect at Bua Labs
The ultimate test of your knowledge is your capacity to convey it to another.

Published by Surapong Kanoktipsatharporn

The ultimate test of your knowledge is your capacity to convey it to another.