การทำ Feature Scaling คือ วิธีการปรับช่วงขอบเขตของข้อมูลชนิดตัวเลข Cardinal แต่ละ Feature (Field) ให้อยู่ในช่วงเดียวกัน ที่เหมาะกับการนำไปประมวลผลต่อ เข้าสูตรคำนวณได้ง่าย เช่น ช่วง [0, 1] หรือ [-1, 1] ได้ผลลัพธ์อยู่ในช่วงที่กำหนด เรียกว่า Data Normalization นิยมทำในขั้นตอน Preprocessing จัดเตรียมข้อมูล ก่อนป้อนให้โมเดลใช้เทรน
ทำไมต้องทำ Normalization ข้อมูล
ข้อมูลดิบที่เราได้รับมานั้นมีความหลากหลาย ทั้งชนิดข้อมูล รูปแบบข้อมูล และ Scale ช่วงของข้อมูล (ข้อมูลตัวเลข Cardinal) เช่น ข้อมูลเด็กมัธยม มี 3 Feature คือ อายุ [10, 20], น้ำหนัก [30, 200] ส่วนสูง [120, 180]
สำหรับอัลกอริทึม Machine Learning หลาย ๆ ตัว ไม่สามารถรับข้อมูลหลากหลาย Scale แบบนี้ได้โดยตรง จำเป็นที่เราต้องทำ Normalization ก่อนที่เราจะป้อนข้อมูลให้กับโมเดล อัลกอริทึมถึงจะสามารถทำงานได้
ยกตัวอย่างเช่น L2 Loss หรือ Mean Squared Error ถ้าค่ายิ่งแตกต่างกันมาก Loss ก็จะยิ่งมากเป็นทวีคูณ เนื่องจากยกกำลังสอง ทำให้ Feature น้ำหนัก ที่จำนวนใหญ่กว่า ช่วงใหญ่กว้างกว่า จะบดบัง Feature อื่น ๆ ไปหมด แต่ถ้าเรา Normalize ทุก Feature ให้เป็น [0, 1] เท่ากันหมด ก็จะแก้ปัญหานี้ได้
การ Normalization ข้อมูล ทำให้อัลกอริทึม Gradient Descent สามารถ Converge ได้เร็วขึ้น อย่างไรจะอธิบายต่อไป
Rescaling (Min-Max Normalization)
Rescaling หรือ Min-Max Normalization เป็นวิธีที่ง่ายที่สุด ที่จะปรับช่วงข้อมูล ให้เป็นอยู่ในช่วง [0, 1] ด้วยการนำ Feature / Column นั้น ๆ ลบด้วยค่าที่น้อยที่สุด (Min) ของมัน แล้วหารด้วยช่วงของข้อมูลนั้น (Max – Min)
\( x’ = \frac{x – \text{min}(x)}{\text{max}(x)-\text{min}(x)}\)Mean Normalization
Mean Normalization คล้ายกับ Rescaling ด้านบน แตกต่างกันที่ใช้ Mean แทน Min ทำให้ช่วงของ Output [-0.5, 0.5] มีทั้งบวกและลบ Balance กัน ตรงเลข 0 (ขยับ Mean มาตรง 0)
\( x’ = \frac{x – \text{average}(x)}{\text{max}(x)-\text{min}(x)} \)เรามักจะเห็น Mean Normalization อีกแบบ ที่หารด้วย Standard Deviation ของมัน ทำให้ Output ที่ออกมามี Standard Deviation เป็น 1 เรียกว่า Standardization
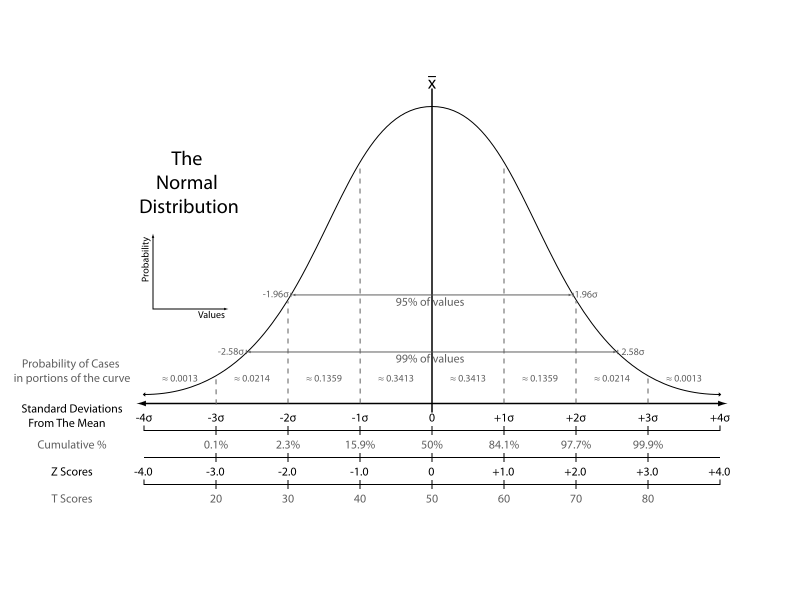
Standardization (Z-Score Normalization)
Standardization หรือ Z-Score Normalization คือ การนำข้อมูล Feature / Column มาปรับให้ Mean = 0 และ Standard Deviation = 1 (Unit Variance)
\( x’ = \frac{x – \bar{x}}{\sigma} \)อัลกอริทึม Machine Learning หลาย ๆ ตัว ต้องการให้เราปรับข้อมูลให้เป็นแบบนี้ก่อน ที่จะป้อนให้โมเดลใช้เทรน
ซึ่งเราต้องเก็บค่า Mean และ Std ไว้ด้วย เวลาที่เราเทสก็ต้องใช้ค่าเดียวกันกับตอนเทรนในการปรับข้อมูล Validation Set / Test Set
Scale to Unit Length
ในกรณีที่ข้อมูลเป็น Vector เราจะหารด้วย Euclidean Norm เพื่อปรับให้เป็น Unit Vector
\( x’ = \frac{x}{\left\|{x}\right\|} \)เรามาเริ่มกันเลยดีกว่า
![]()
![]()