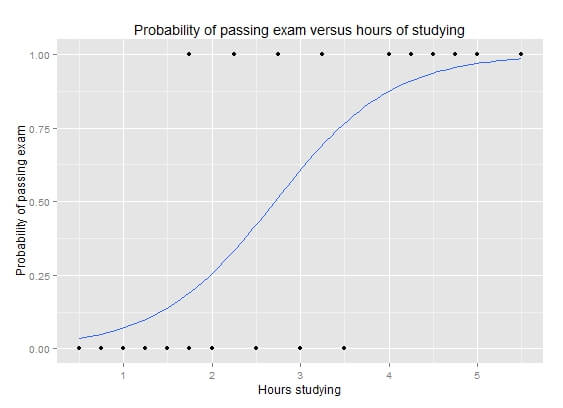
ใน ep ก่อนเราพูดถึง Loss Function สำหรับงาน Regression กันไปแล้ว ในตอนนี้เราจะมาพูดถึง Loss Function อีกแบบหนึ่ง ที่สำคัญไม่แพ้กัน ก็คือ Loss Function สำหรับงาน Classification เรียกว่า Cross Entropy Loss หรือ Logistic Regression

ไอเดียของ Loss Function แบบ Classification คือ เราต้องการตัวชี้วัด เป็นตัวเลขค่าเดียว ที่บอกว่า โมเดลของเราทำงานได้ดีแค่ไหน โดยเปรียบเทียบ Output ของ โมเดล เช่น โมเดลทำนายว่ารูปภาพนี้ น่าจะเป็น Dog 80% น่าจะเป็น Cat 20% กับค่า Ground Truth รูป Dog 1 ตัว
เราไม่สามารถนำทั้งสองค่า มาบวกลบกันได้ตรง ๆ เหมือน MAE, MSE แต่ต้องเปรียบเทียบผ่านฟังก์ชัน Softmax และ Negative Log Likelihood ด้านล่างเสียก่อน
สูตร Softmax Function
\( \sigma(\mathbf{z})_i = \frac{e^{z_i}}{\sum_{j=1}^K e^{z_j}} \text{ for } i = 1, \dotsc , K \text{ and } \mathbf z=(z_1,\dotsc,z_K) \in R^K \)สูตร Binary Cross Entropy (Log Loss)
\( \begin{align}J(\mathbf{w})\ &=\ \frac1N\sum_{n=1}^N H(p_n,q_n)\ =\ -\frac1N\sum_{n=1}^N\ \bigg[y_n \log \hat y_n + (1 – y_n) \log (1 – \hat y_n)\bigg]\,,
\end{align} \)
ให้ฟังก์ชันเหล่านี้จัดการ Probability หรือ ความมั่นใจของโมเดล ว่า
- ทายถูก ด้วยความมั่นใจ ถึงจะเรียกว่าดี Loss ก็จะน้อย
- แต่ถ้าทายถูก แบบไม่มั่นใจ ก็จะทำโทษ ให้ Loss มาก
- หรือ แม้ทายผิด แต่ดันมั่นใจมาก ก็จะทำโทษให้ Loss มาก เช่นกัน


